Decision Tree Analysis : In some situations the decision maker is required to take decisions at more than one stage. Such situations are also called sequential or multi – stage decision problems.
In these problems the decision taken at one stage makes the difference in the decision making in the next stages. Hence the best decision at any stage is based on decisions taken in the previous stages. For this purpose the decision flow diagram or tree diagram is used.
A Decision Tree present a clear, logical model that can be understood easily by people who are not mathematically inclined. It is a diagrammatic representation of the decision problem and its solution. It enables the decision maker to see the various stages of his problems in proper sequence and perspective in a systematic manner.
However, the criteria of decision making remain the same like EMV or EOL as used in the earlier decision problems. The tree diagram consist of,
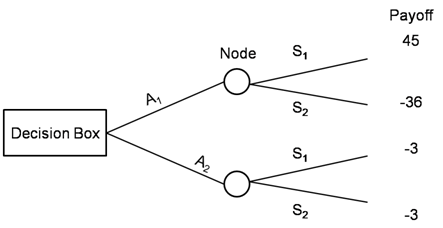
Decision Box : Denotes the course of action
Node : Show the decision branches or Course of actions
Arrows : Show the decision branches or Course of actions
For the illustrative example of TV set marketing, we can draw the decision tree as follows.
In the diagram the first set of arrows represents the 2 courses of actions A1 & A2 available with the manager. Whereas the second sets represent the events (states of nature) in terms of success of the product. These events occur on each of the course of action on the decision tree.
The payoffs represent the possible profit or loss to the manager by selecting the respective course of action.


46 Comments